Hallo! Tracked shipping to Netherlands with Delivery Duty Paid for just €7 

Ship to
Netherlands
0
  • argentina
  • chile
  • colombia
  • españa
  • méxico
  • perú
  • estados unidos
  • internacional

Select your country

Americas

Europe

Rest of the world

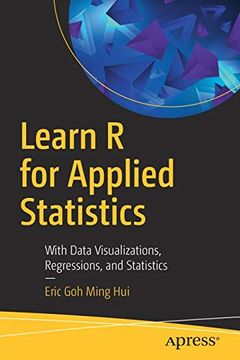
portada Learn r for Applied Statistics: With Data Visualizations, Regressions, and Statistics
Type
Physical Book
Publisher
Year
2018
Language
English
Pages
260
Format
Paperback
Dimensions
23.4x15.6x1.4 cm
Weight
0.37 kg.
ISBN13
9781484241998
Edition No.
1

Learn r for Applied Statistics: With Data Visualizations, Regressions, and Statistics

Eric Goh Ming Hui (Author) · Apress · Paperback

Learn r for Applied Statistics: With Data Visualizations, Regressions, and Statistics - Hui, Eric Goh Ming

Cheaper New Book Imported to Netherlands
Delivery: 06 Oct - 13 Oct Shipping: 12 to 16 business days.
€ 47,31
Faster New Book Imported to Netherlands
Delivery: 25 Sep - 29 Sep Shipping: 5 to 6 business days.
€ 69,09
Import costs and 9% BTW included in the price ✅
€ 47,31

Synopsis "Learn r for Applied Statistics: With Data Visualizations, Regressions, and Statistics "

Gain the R programming language fundamentals for doing the applied statistics useful for data exploration and analysis in data science and data mining. This book covers topics ranging from R syntax basics, descriptive statistics, and data visualizations to inferential statistics and regressions. After learning R's syntax, you will work through data visualizations such as histograms and boxplot charting, descriptive statistics, and inferential statistics such as t-test, chi-square test, ANOVA, non-parametric test, and linear regressions. Learn R for Applied Statistics is a timely skills-migration book that equips you with the R programming fundamentals and introduces you to applied statistics for data explorations. What You Will LearnDiscover R, statistics, data science, data mining, and big dataMaster the fundamentals of R programming, including variables and arithmetic, vectors, lists, data frames, conditional statements, loops, and functionsWork with descriptive statistics Create data visualizations, including bar charts, line charts, scatter plots, boxplots, histograms, and scatterplotsUse inferential statistics including t-tests, chi-square tests, ANOVA, non-parametric tests, linear regressions, and multiple linear regressionsWho This Book Is ForThose who are interested in data science, in particular data exploration using applied statistics, and the use of R programming for data visualizations.

Customers reviews

Frequently Asked Questions about the Book

All books in our catalog are Original.
The book is written in English.
The binding of this edition is Paperback.

Questions and Answers about the Book

Do you have a question about the book? Login to be able to add your own question.

Opinions about Bookdelivery

More customer reviews